liste

Bonjour et bienvenue dans mon site ! Willkommen auf meiner Seite! welcome in my homepage! http://assistance-en-sig.blogspot.com/ SIG ; Bases de données ; Géomatique; Python; ArcGIS; QGIS;

recherche

Showing posts with label arcGIS. Show all posts

Monday, November 25, 2013

Apprentissage d’ArcGIS


Introduction 3
1 Bienvenue dans ArcGIS 5
Que permet de faire ArcGIS ? 6
Projets uniques pour les activités quotidiennes 9
Tâches réalisées avec ArcGIS 11
Conseils d’apprentissage d’ArcGIS 17
2 Exploration d’ArcCatalog et d’ArcMap 19
Introduction à ArcCatalog 20
Affichage des données dans ArcCatalog 21
Se connecter à vos données 23
Présentation d’ArcMap 27
Utilisation de cartes 28
Utilisation de cartes 29
Ajout d’une couche à une carte 33
Ajout d’entités à partir d’une base de données 34
Modification de la manière de tracer les entités 36
Ajout d’étiquettes à une carte 39
Travail sur la mise en page des cartes 41
Enregistrement d’une carte 48
Impression d’une carte 49
Et ensuite ? 50
3 Exploration des données SIG 51
Modèles de données géographiques 52
Formats de données d’entité 57

lire la suite

Sunday, November 10, 2013

Introduction to GIS modeling and Python

Overview

Welcome to http://assistance-en-sig.blogspot.com/. Over the next ten weeks you'll work through four lessons and a final project dealing with ArcGIS automation in Python. Each lesson will contain readings, examples, and projects. Since the lessons are two weeks long, you should plan between 20 - 24 hours of work to complete them, although this number may vary depending on your prior programming experience. See the Course Schedule section of this syllabus, below, for a schedule of the lessons and course projects.
As with GEOG 483 and GEOG 484, the lessons in this course are project-based with key concepts embedded within. However, because of the nature of computer programming, there is no way this course can follow the step-by-step instruction design of the previous courses. You will probably find the course to be more challenging than the others. For that reason, it is more important than ever that you stay on schedule and take advantage of the course message boards and private e-mail. It's quite likely that you will get stuck somewhere during the course, so before getting hopelessly frustrated, please seek help from me or your classmates!
I hope that by now that you have reviewed our Orientation and Syllabus for an important course site overview. Before we begin our first project, let me share some important information about the textbook and a related Esri course.

Textbook and readings

The textbook for this course is Python Scripting for ArcGIS by Paul A. Zandbergen. This book came out in 2012 and has been a hot item among Esri software users; I suggest you order your copy immediately in case of shortages or delays.
Back when Geog 485 was rewritten as a Python course, there was no textbook available that tied together ArcGIS and Python scripting. As you read through Zandbergen's book, you'll see material that closely parallels what is in the Geog 485 lessons. This isn't necessarily a bad thing; when you are learning a subject like programming, it can be helpful to have the same concept explained from two angles.
My advice about the readings is this: Read the material on the Geog 485 lesson pages first. If you feel like you have a good understanding from the lesson pages, you can skim through some of the more lengthy Zandbergen readings. If you struggled with understanding the lesson pages, you should pay close attention to the Zandbergen readings and try some of the related code snippets and exercises. I suggest you plan about 1 - 2 hours per week of reading if you are going to study the chapters in detail.
In all cases, you should get a copy of the textbook because it is a relevant and helpful reference.

Esri Virtual Campus Courses Using Python in ArcGIS Desktop 10

There is a free Esri Virtual Campus course, Using Python in ArcGIS Desktop 10, that introduces a lot of the same things you'll learn this quarter in Geog 485. The course consists of a one-hour recorded seminar and a walkthrough exercise. If you want to get a head start, or you feel you want some reinforcement of what we're learning from a different point of view, it would be worth your time to complete this Virtual Campus course.
All you need in order to access this course is an Esri Global Account, which you can create for free. You do not need to obtain an access code from Penn State.
The video moves very quickly and covers a range of concepts that we'll spend 10 weeks studying in depth, so don't worry if you don't understand it all immediately. You might find it helpful to watch the video again near the end of Geog 485 to review what you've learned.

Questions?

If you have any questions now or at any point during this week, please feel free to post them to the Lesson 1 Discussion Forum. (To access the forums, return to ANGEL via the ANGEL link in the Resources menu. Once in ANGEL, you can navigate to the Communicate tab and then scroll down to the Discussion Forums section.) While you are there, feel free to post your own responses if you, too, are able to help a classmate.
Now, let's begin Lesson 1.

1.2.1 Exploring the toolbox

The ArcGIS software that you use in this course contains hundreds of tools that you can use to manipulate and analyze GIS data. Back before ArcGIS had a graphical user interface (GUI), people would access these tools by typing commands. Nowadays, you can point and click your way through a whole hierarchy of toolboxes using ArcCatalog or the Catalog window in ArcMap.
Although you may have seen them before, let’s take a quick look at the toolboxes:
  1. Open ArcMap.
  2. If the Catalog window isn't visible, click the Windows menu, then click Catalog. (If you've used previous versions of ArcGIS, this is a new window at version 10 that allows you to have a lot of the ArcCatalog functionality available in ArcMap.) If you hover over or click the Catalog item on the right side of your screen, you can make the Catalog window appear. Optionally, you can "pin" it down so that it doesn't hide itself.
  3. In the Catalog, expand the nodes Toolboxes > System Toolboxes and continue expanding the toolboxes of your choice until you see some of the available tools. Notice that they’re organized into toolboxes and toolsets. Sometimes it’s faster to use the Search window to find the tool you need instead of browsing this tree.
  4. Let’s examine a tool. Expand Analysis Tools > Proximity > Buffer, and double-click the Buffer tool to open it.
    At this point, you’re looking at a dialog with many fields. Each geoprocessing tool has required inputs and outputs. Those are indicated by the green dots. They represent the minimum amount of information you need to supply in order to run a tool. For the Buffer tool, as inputs, you’re required to supply an input features location (the features that will be buffered) and a buffer distance. You’re also required to indicate an output feature class location (for the new buffered features).
    Many tools also have optional parameters. You can modify these if you want, but if you don’t supply them, the tool will still run using default values. For the Buffer tool, optional parameters are the Side Type, End Type, Dissolve Type, and Dissolve Fields. Optional parameters are typically specified after required parameters.
  5. Click the Show Help button in the lower-right corner of the tool (if it says Hide Help then you’re already viewing help). You can now click on any parameter in the dialog to see an explanation of that parameter appear in the right-hand window.
    If you’re not sure what a parameter means, this is a good way to learn. For example, with the help still open, click the Side Type input box on the Buffer tool (right where it says "FULL"). The Help explains what the Side Type parameter means and lists the different options: FULL, LEFT, RIGHT, and OUTSIDE_ONLY.
If you need even more help, each tool is fully documented in the ArcGIS Desktop Help. You could go directly to the Buffer tool help by clicking the Tool Help button in the tool dialog box, but in this course you'll often want to get to these help pages without opening the tool itself. Below are the steps for doing so.
  1. From the main menu of ArcMap, click Help > ArcGIS Desktop Help. Optionally, for the most up-to-date help, you can use the Web-based help at http://webhelp.esri.com. (All links to the Help in this course will open the Web Help.)
  2. In the ArcGIS Desktop Help table of contents, expand Professional Library > Geoprocessing > Geoprocessing tool reference. (If you are using 10.1, browse to Geoprocessing > Tool Reference instead.) Notice that the help topics in this section are organized into toolboxes and toolsets, paralleling the layout of the ArcGIS System Toolboxes.
  3. Continue navigating the help table of contents to Analysis toolbox > Proximity toolset > Buffer. Scroll through the entire topic examining all the information that is given about the Buffer tool. Here you get tips about what the Buffer tool does, how to use it, a full list of parameters, and scripting examples written in Python. These scripting examples will be extremely valuable to you as you complete the assignments in this course and you should always check the Geoprocessing Tool Reference in the Help if you’re having trouble getting a tool to run in Python.

1.1.1 The need for GIS automation

A geographic information system (GIS) can manipulate and analyze spatial datasets with the purpose of solving geographic problems. GIS analysts perform all kinds of operations on data to make it useful for solving a focused problem. This includes clipping, reprojecting, buffering, merging, mosaicking, extracting subsets of the data, and hundreds of other operations. In the ArcGIS software used in this course, these operations are known asgeoprocessing and they are performed using tools.
Successful GIS analysis requires selecting the right tools to operate on your data. ArcGIS uses a toolbox metaphor to organize its suite of tools. You pick the tools you need and run them in the proper order to make your finished product.
Suppose you’re responsible for selecting sites for video stores. You might use one tool to select land parcels along a major thoroughfare, another tool to select parcels no smaller than 0.25 acres, and other tools for other selection criteria.  If this selection process were limited to a small area, it would probably make sense to perform the work manually. 
However, let’s suppose you’re responsible for carrying out the same analysis for several areas around the country.  Because this scenario involves running the same sequence of tools for several areas, it is one that lends itself well to automation. There are several major benefits to automating tasks like this:
  • Automation makes work easier. Once you automate a process, you don't have to put in as much effort remembering which tools to use or the proper sequence in which they should be run.
  • Automation makes work faster. A computer can open and execute tools in sequence much faster than you can accomplish the same task by pointing and clicking.
  • Automation makes work more accurate. Any time you perform a manual task on a computer, there is a chance for error. The chance multiplies with the number and complexity of the steps in your analysis. In contrast, once an automated task is configured, a computer can be trusted to perform the same sequence of steps every time.
ArcGIS provides three ways for users to automate their geoprocessing tasks. These three options differ in the amount of skill required to produce the automated solution and in the range of scenarios that each can address.
The first option is to construct a model using Model Builder. Model Builder is an interactive program that allows the user to “chain” tools together, using the output of one tool as input in another. Perhaps the most attractive feature of Model Builder is that users can automate rather complex GIS workflows without the need for programming. You will learn how to use Model Builder early in this course.
Some automation tasks require greater flexibility than is offered by Model Builder, and for these scenarios it's recommended that you write scripts. The bulk of this course is concerned with script writing.

A script is a program that executes a sequential procedure of steps. Within a script, you can run GIS tools individually or chain them together. You can insert conditional logic in your script to handle cases where different tools should be run depending on the output of the previous operation. You can also include iteration, or loops, in a script to repeat a single action as many times as needed to accomplish a task.
There are special scripting languages for writing scripts, including Python, JScript, and Perl. Often these languages have more basic syntax and are easier to learn than other languages such as C, Java, or Visual Basic.
Although ArcGIS supports various scripting languages for working with its tools, Esri emphasizes Python in its documentation and includes Python with the ArcGIS install. In this course we’ll be working strictly with Python. You’ll learn the basics of the Python language, how to write a script, and how to manipulate and analyze GIS data using scripts. Finally, you’ll apply your new Python knowledge to a final project, where you write a script of your choosing that you may be able to apply directly to your work.
The third option available to ArcGIS users looking to automate geoprocessing is to build a solution using ArcObjects, the programming building blocks used by Esri’s own developers to produce the ArcGIS desktop products. With ArcObjects, it is possible to customize the user interface to include specific commands and tools that either go outside the abilities of the out-of-the-box ArcGIS tools or modify them to work in a more focused way. ArcObjects programming and interface customization are outside the scope of this course, but are covered in the GIS Application Development course, GEOG 489. GIS customization with ArcObjects can be an advanced endeavor, and learning a scripting language like Python is a good way to prepare yourself by learning basic programming concepts.
The tools that you run in ModelBuilder and Python actually use ArcObjects "under the hood" to run GIS functions; however, the advantage of Python scripting with ArcGIS is that you don't need to learn all the ArcObjects logic behind the tools. Your job is just to learn the tools and how to run them in the appropriate order to accomplish your task.
This first lesson will introduce you to concepts in both model building and script writing. We’ll start by just getting familiar with how tools run in ArcGIS and how you can use those tools in the ModelBuilder interface. Then, we’ll cover some of the basics of Python and see how the tools can be run within scripts.

Lesson 1 checklist -ArcGIS Python

This lesson is two weeks in length. (See the Calendar in ANGEL for specific due dates.) To finish this lesson, you must complete the actvities listed below. You may find it useful to print this page so that you can follow along with the directions. 
  1. Download the Lesson 1 data and extract it to C:\WCGIS\Geog485\Lesson1 or a similar path that is easy to remember.
  2. Work through the online sections of Lesson 1.
  3. Read Zandbergen chapters 2 - 3. In the online lesson pages I have inserted instructions about when it is most appropriate to read each of these chapters.
  4. Complete Project 1, Part I and submit the deliverables to the course drop box.
  5. Complete Project 1, Part II and submit the deliverables to the course drop box.
  6. Complete the Lesson 1 Quiz.

Wednesday, October 30, 2013

Getting Started with ArcGIS (Data and eBook)

An eBook to get you started learning ArcGIS. The dataset for this ebook is also included here. Though the ebook version is for the ArcGIS Desktop 10.X release, you can still use it to work in 9.3.1.
here
Taille: 18.54 MiB (19444969 Bytes)

Saturday, October 5, 2013

ESRI ArcGIS Developer - Desktop, ArcGIS Server, Web Server

Location:
Northern Ireland , UK
Salary:
From £37,000 to £45,000 per annum negotiable depending on skills
Date posted:
27/09/2013 09:01
Job type:
Permanent
Company:
Advanced Selection
Contact:
Jon Holgate
Ref:
Totaljobs/JHASP31
Job ID:
57567589
ESRI GIS Developer - Desktop, ArcGIS Server, Web Server - Northern Ireland, £37k to £45k

My client, an outsource and consulting firm, has identified the need for additional ArcGIS development skills in the support or current projects and new enhancements in the pipeline. The job will involve working on ArcGIS Desktop, ArcGIS Server and Web Mapping projects and a combination of two or more of these skill sets is required here. Skills profile includes: C#, python, API's, .NET, SQL Server, JavaScript, Model Maker etc....

You will be an accomplished and highly proficient ESRI GIS Developer with current in depth knowledge of ESRI product range and hands on skills in at least two of the following: ArcGIS Desktop Development, ArcGIS Server Development, Web Server / Web Mapping development. You will also have client facing skills as the role will involve working with the customer to ascertain future requirements, updates and integration needs.

This is a great opportunity to advance your career in GIS with a growing organisation

If this appeals to you then please apply
Activate One Click Apply. What is One Click Apply? 
Please note: You should never need to provide bank account details or any other financial information, or make any form of payment, when applying for a job

Wednesday, August 21, 2013

Extend Crime Analysis with ArcGIS 10 Spatial Statistics Tools

By Lauren Scott and Nathan Warmerdam

Editor's note: Crime mapping using traditional GIS analysis techniques has been helping law enforcement agencies track crime incidents and produce density maps showing overall crime patterns. With improvements in the availability and quality of crime data in digital format and more robust GIS software, police departments have expanded the use of GIS. They are using spatial data analysis to assess crime patterns, optimize resource allocation, and improve emergency call response. The spatial statistics tools in ArcGIS enhance spatial data analysis of crime data by supplying tools that use statistical methods designed specifically for use with spatial data. This article describes how the Hot Spot Analysis, Mean Center, Linear Directional Mean, and Standard Deviational Ellipse tools, available at all license levels, can be used for more sophisticated types of crime analysis.

Understanding Where Crime Occurs

Crime hot spots are areas of high crime intensity. Knowing where crime is concentrated helps law enforcement agencies make better decisions about allocating police resources. In addition, using GIS to map crime hot spots can effectively communicate crime patterns and crime prevention strategies to decision makers and the public.
The Hot Spot Analysis tool in ArcGIS 9 identifies spatial clusters of statistically significant high or low attribute values. Given a set of weighted data points, such as the number of crimes per census block, and operating under the expectation that data values are randomly distributed across the study area, this tool delineates clusters of census blocks with higher than expected crime incidents. These clusters are hot spots. The Hot Spot Analysis tool also delineates spatial clusters of lower than expected crime incidents. These clusters reflect crime cold spots and may provide clues about policy or environmental factors that discourage crime.
click to enlargeclick to enlarge
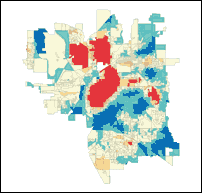
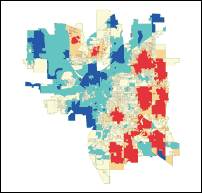
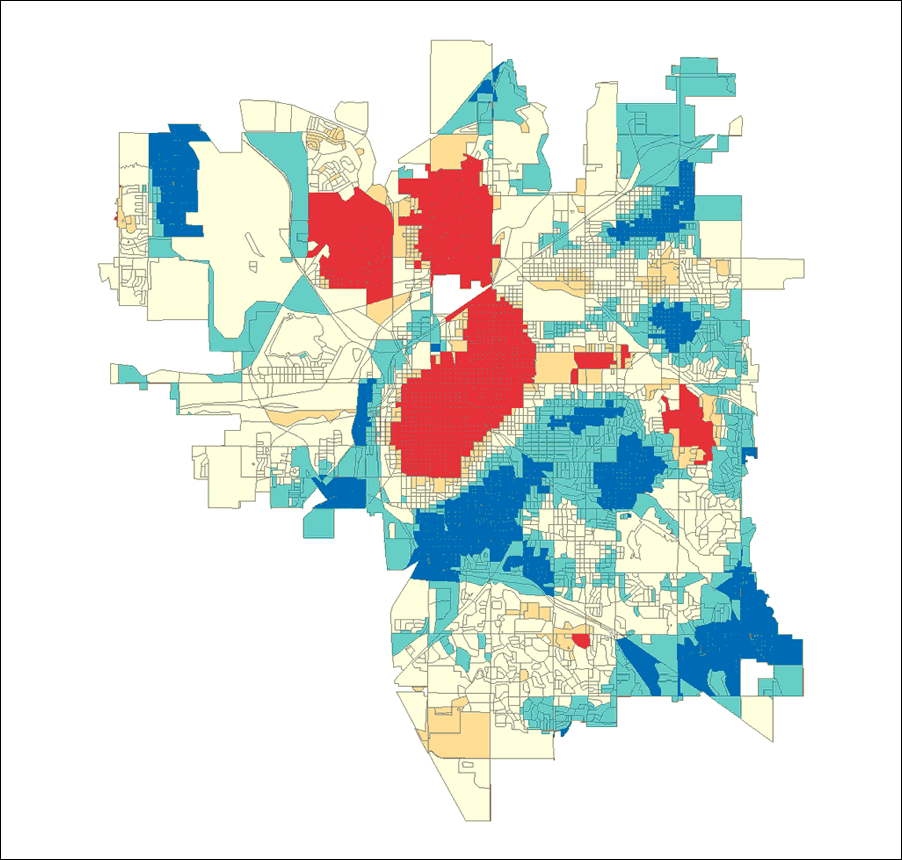
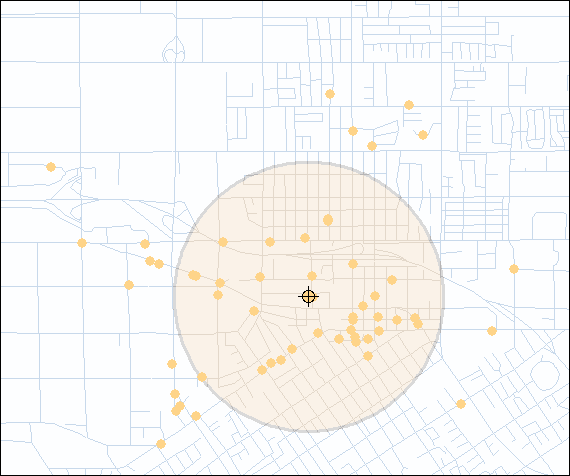
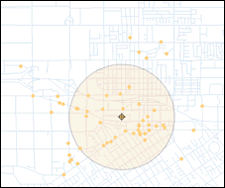
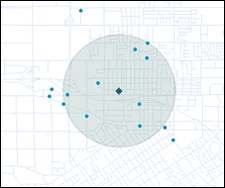
Crime hot spots generated from vandalism data for Lincoln, Nebraska, that have not been normalized. Hot spots are shown in bright red and located in downtown Lincoln, an area with a large population. Cold spots, or areas of low crime, are shown in dark blue and are located in suburban areas.Hot spot analysis using vandalism data that was normalized with data from all crime incidents for Lincoln, Nebraska. Again, areas with high incidence of vandalism are shown in bright red and low vandalism areas are shown in dark blue.
Running the Hot Spot Analysis tool against raw total crime counts provides the analyst with an overall picture of crime patterns. A map of these crime patterns effectively communicates where crime activities are highest and where they are lowest. However, the police officers working in the study area day to day will likely already know firsthand where crime activities are highest. Often more useful are analyses that incorporate risk assessment by controlling study area variations in population, overall crime patterns, and environmental factors.

Performing Risk Assessment

One would expect more crimes in areas with more people and fewer crimes in areas with fewer people. Communities are a tapestry of neighborhoods (each one with different characteristics). In essence, a study area can be viewed as a landscape of crime. Gang activities; the types of businesses in an area; and factors that can be difficult to quantify, such as lighting, access to freeways, or a high proportion of residents with criminal records, can drive up the crime rate in some neighborhoods.
For example, if the task is to determine where to implement a vandalism prevention program, simply running the Hot Spot Analysis tool on raw vandalism counts will probably find hot spots just where they would be expected (in downtown areas that have lots of people and, typically, lots of crime). However, dividing vandalism counts in each census tract by all crime counts will represent vandalism counts as a proportion of all crime events. Running the hot spot analysis on these normalized ratios will provide a different picture. It will show the location of clusters of tracts in which vandalism represents a larger than expected proportion of all crime events. Such an analysis, carried out on crime data from Lincoln, Nebraska, showed that vandalism is primarily a suburban issue. Consequently, implementing a vandalism prevention program in the downtown area probably would not be as effective as implementing a program in the suburbs where vandalism constitutes a larger proportion of overall crime events.
click to enlargeclick to enlarge
Daytime burglaries tend to be slightly more concentrated than nighttime burglaries, indicated by the smaller standard distance circle. These circles also highlight the differences in the locations of daytime and nighttime burglaries.

Looking for Clues to Criminal Activities

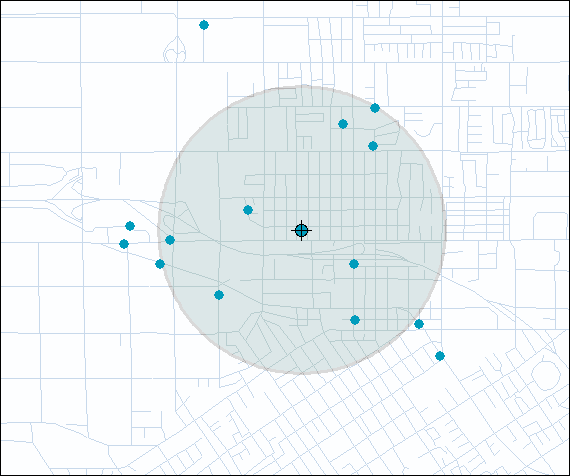
One of the simplest approaches to better understand some factors that encourage criminal activity is examining the distribution of different types of crimes. A crime analyst, for example, might want to know if the mean center for burglaries shifts when evaluating daytime versus nighttime crime incidents. This information could be used to improve the way police departments assign personnel. The Mean Center tool available in ArcGIS 9 computes the average x-coordinate and y-coordinate for each crime incident in the study area.
Another new tool for studying the distribution of crime incidents works with line data. The Linear Directional Mean tool is used to measure the trend of either the direction or orientation of line features by calculating the average angle of the lines. This statistic can be used to evaluate auto theft data that contains information on the location from which each vehicle was taken and where it was eventually recovered. Analyzing this data using the Linear Directional Mean tool highlights recurring patterns that can suggest an underlying infrastructure supporting car thefts in the region. Similar analysis has been used to study data on missing/abducted children.
click to enlarge
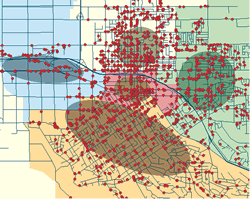
Analysis of the spatial dispersion of crimes by police beat in Redlands, California, shows that crimes in the western portion of the city follow major transportation networks in the area.
When crime distributions are compared to other features in the landscape, similarities or relationships often become apparent. The most common way for measuring the trend for points or areas is to calculate the standard distance separately in the x and y directions. These two measures define the axes of an ellipse encompassing the distribution of features. The ellipse is referred to as the standard deviational ellipse since the method calculates the standard deviation of the x-coordinates and y-coordinates from the mean center to define the axes of the ellipse. This ellipse shows if the distribution of features is elongated, which indicates it has a particular orientation.
For example, crime events grouped by police beat and evaluated using the Standard Deviational Ellipse tool may show that, for some police beats, crime activities are evenly distributed throughout the beat so the ellipse resembles a circle. In other cases, crime activities tend to follow road networks, and crime incidents in these police beats show that orientation.

Conclusion

By placing crime incidents in a geographic context and applying the spatial statistical analysis tools now available in ArcGIS 9, crime analysts can better understand where and why crime activity is occurring and law enforcement agencies can respond in the most efficient and effective manner.

Additional Resources

Not only crime analysts but also GIS practitioners in many research areas, such as epidemiology, archaeology, wildlife biology, and retail analysis, will benefit from the spatial statistics tools in ArcGIS 9. These tools can be easily modified or extended because most were written using the Python scripting language. The source code for the statistical tools can be accessed from ArcToolbox and serve as samples and templates for further customization. For more information about scripting in the ArcGIS geoprocessing environment, select Geoprocessing >Writing Geoprocessing Scripts on the Contents tab of the ArcGIS 9 Online Help.
click to enlarge
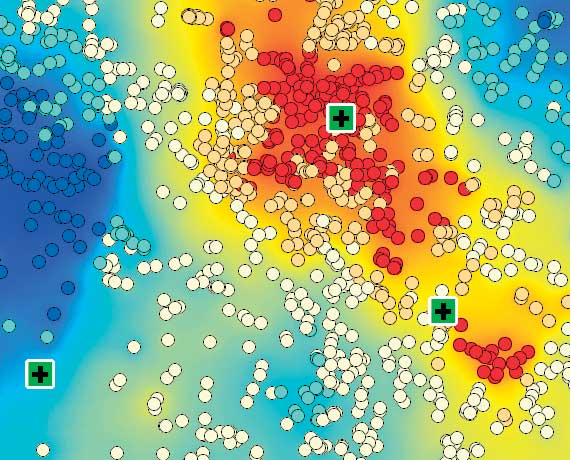
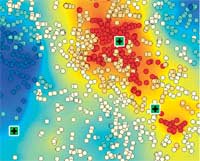
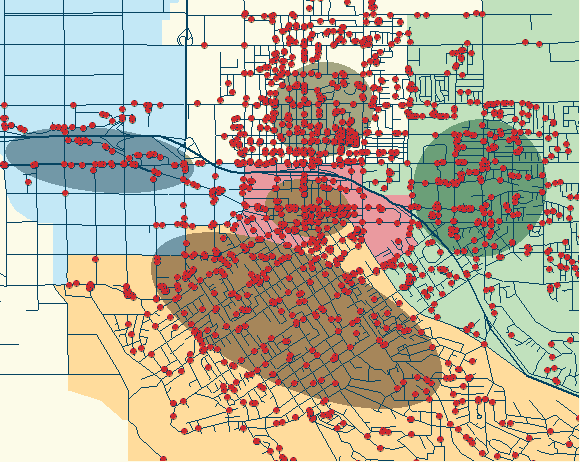
Analysis of 911 emergency calls shows regions that get many calls in bright red and regions that get few calls in dark blue and the relationship of those areas to local police and fire response stations, indicated by bright green squares.
The Esri Guide to GIS Analysis, Volume 2, an Esri Press book scheduled for release in the third quarter of 2005, provides additional specific information on spatial statistics tools and more general information on spatial data analysis using GIS. It is the second in a series by Andy Mitchell. The first book,The Esri Guide to GIS Analysis, Volume 1, focuses on visual and cartographic methods of spatial data analysis. Both books can be purchased online at www.esri.com/shop.
Online resources are also available. A five-minute video showing hot spot analysis of emergency 911 call data is available on the Esri Web site. An article describing the tools in the Spatial Statistics toolbox appeared in the October–December 2004 issue of ArcUser and is available online. For more information on the Python scripting language, visit www.Python.org.

About the Authors

Dr. Lauren Scott works on the ArcGIS Geoprocessing Team and developed the tools in the Spatial Statistics toolbox. She holds a Ph.D. in geography from the joint doctoral program at San Diego State University in California and the University of California, Santa Barbara.
Nathan Warmerdam works as a product specialist on the Geoprocessing Team. He holds a master's degree in geographic information science from the University of Redlands in California.
source esri.com

Wednesday, July 10, 2013

FGDC Digital Cartographic Standard for Geologic Map Symbolization


What is this Standard?


The Federal Geographic Data Committee (FGDC) has endorsed this document as the National Standard for the digital cartographic representation of geologic map features. The standard is intended to support the Nation's producers and users of geologic map information by providing line symbols, point symbols, and colors and patterns that can be used to portray the various features on geologic maps. The objective is to aid in the production of geologic maps and related products, as well as to help provide geologic maps and products that are more consistent in both their appearance and their underlying database content.
The standard contains descriptions, examples, cartographic specifications, and notes on usage for a wide variety of symbols that may be used on typical, general-purpose geologic maps and related products such as cross sections. However, the standard also can be used for different kinds of special-purpose or derivative map products and databases that may be focused on a specific geoscience topic (for example, slope stability) or class of features (for example, a fault map). The standard is scale-independent, meaning that the symbols are appropriate for use with geologic mapping compiled or published at any scale. It is designed to be useful to anyone who either produces or uses geologic map information, whether in analog or digital form.

Who should use it?

This standard is applicable to all geologic map information (in other words, geologic maps and databases) published by the Federal Government and its Federally funded contractors and collaborators. Non-Federal agencies and private firms that produce geologic map information also are urged to adopt the standard. The standard applies to all forms of geologic map publications, whether they are released as (1) hard-copy products, in either offset-print or plot-on-demand format, or (2) digital products, either as files for spatial analysis in Geographic Information Systems (GIS), as Portable Document Format (PDF) files in online publications, or as browse-graphic files for display on the World Wide Web. In particular, the standard applies to all geologic map products archived within the National Geologic Map Database (NGMDB), which is administered by the USGS: geologic map products submitted to and incorporated within the NGMDB will conform to this standard.

EBOOK CHAPTERS – ARCGIS SERVER API FOR JAVASCRIPT

Each chapter from my e-book, The “GIS Geeks Guide to Mastering the ArcGIS Server API for JavaScript” is posted here.  The chapters are free to everyone in pdf format.

Note: For a more in-depth treatment of the ArcGIS Server API for JavaScript please refer to our Building Custom ArcGIS Server Applications with JavaScript course.  This course is offered as both a traditional instructor led course and an instructor guided online course.

ArcMap Tutorial

The best way to learn ArcMap is to try it yourself. This tutorial guides you through some basic ArcMap skills as you create and print a set of maps for a county that is planning to expand its airport.
Residents of the county have identified several issues they are concerned about. These include noise affecting schools and houses near the airport and increased traffic along major roads. In this tutorial, you’ll first create and print a map showing schools near the airport. Then you’ll place this map—along with two other maps that show land use surrounding the airport and population density for the county—on a wall-sized poster for display.
In the tutorial, you’ll learn how to:
• Display map features.
• Add data to your map.
• Edit geographic data.
• Work with data tables.
• Query and select geographic features.
• Create a summary graph.
• Layout and print a map.
There are five exercises. Each exercise takes between 30 and 45 minutes to complete. You can work through the entire tutorial or complete each lesson one at a time.

Monday, May 27, 2013

ArcGIS on a Mac?

Many people have asked members of the ESRI Education Team about whether ArcGIS works on Intel-based Macintosh computers. Thanks to some tools presented by Apple and by Parallels, we can respond with a clear “Yes!”, but with the understanding that the user must have a licensed
copy of Microsoft Windows XP and be facile with Windows-based operations.
Apple offers a strategy called “BootCamp” (www.apple.com/macosx/bootcamp) which
allows the user of OS 10.4 to install some special drivers and then install a
fully functioning version of Windows XP. Then the user can install and use
Windows-based applications, including ArcGIS Desktop, which runs quite nicely
on the Intel-based Macs. These computers are essentially just regular PCs with
some slightly different port configurations. The user chooses at boot-up which
OS to run — WinXP or MacOSX — and stays there until rebooting. All internal
resources focus on running the one system.

Parallels (www.parallels.com)
takes a different strategy. They sell an application “Desktop 3.0 for
Macintosh” (retail of $80) that sits on top of MacOSX, partitions the hard
drive, and allows installation of Windows (we tested using XP Pro) and
applications. The user can run programs in MacOS and Windows simultaneously,
and the hardware does some nifty shifting of resources to allow programs to run
at nearly full speed. There was some degradation of performance on our test
machine (MacBook Pro with 2 GB RAM), but it was modest and ArcGIS performance
was peppy enough for use in classroom instruction. I was even able to install
and operate ArcGIS Server and ArcIMS as well as ArcInfo, and run them simultaneously,
viewing data from ArcIMS on my Mac-based AEJEE while viewing data from ArcGIS
Server on my PC-based ArcMap.
Many parameters and settings can influence your performance,
but the bottom line is that, if you are interested in running ArcGIS products
on an Intel-based Macintosh, it can be done pretty well.
Charlie Fitzpatrick, ESRI Education Manager

Saturday, May 25, 2013

ArcGIS Installation Instructions

ArcGIS Installation Instructions

NOTES:
  • There are minor (negligible) differences in the installation between 10.0 and 10.1. The instructions below are for 10.0 Education Edition installation. 
  • John Weeks, maintains a set of ESRI Support pages for USU staff and students, that provide similar instructions for a wider range of scenarios if you are using one of our campus site licenses (e.g. Manual ArcGIS License Renewal)

Step One: Authorize EVA

The first step is to authorize the registration number provided for you inside the DVD case.
Go to http://www.esri.com/EducationEdition to activate your authorization number (the 12-digit number beginning with EVA)

You will need to log in with your ESRI account credentials, or create a new account.
Upon creating a new account, you will be asked to enter your registration number. ESRI will then send you an email with the same authorization number telling you that the number is ready for use. You can then proceed to step two (note if you accidently install ArcGIS before doing this, you will still be able to use the ArcGIS Administrator (accessed from Start -> Programs -> ArcGIS -> ArcGIS Administrator) to authenticate the installation after the fact.

Step Two: Install ArcGIS

These procedures work whether you download the installation files or use the installation DVD for ArcGIS Desktop 10 available from Software Licensing.
Insert the disc and you will see the main menu below (if the AutoPlay does not run, use the ESRI.exe to bring up the main menu):
If you have old versions of ArcGIS (e.g. 9.3.1) you will need to uninstall them first. You can use the ‘Uninstall Existing ArcGIS Software’ to make sure this has taken place.
Next you will want to install the ArcGIS Desktop. Run the ‘Setup’ next to  ArcGIS Desktop. In the install process, choose a complete install so that ArcGIS installs all the extensions, Python and other options (Custom if you want to choose not to install some of these extra components):
The other parts of the setup are straight forward and the installation may take several minutes (upto 30 minutes on a slow machine):
Upon completion of the ArcGIS Desktop 10 Setup, you will see this dialog:

Click Finish and the ArcGIS Administration Wizard will automatically start.

Step Three: ArcGIS Administrator

The Administration Wizard is where you specify the type of ArcGIS Desktop product you want to authorize and authenticate your license. If you do not have internet access or you have not completed the Step One Above to authenticate the authorization codes at http://www.esri.com/EducationEdition, you can cancel away from this step and authorize your product later using the License Manager. Otherwise,
This will bring up the wizard. For an Educational edition you want to click on the Desktop and then change the settings in the dialog below to ArcInfo (Single Use) and then click on Authorize Now.

As you have already installed your software, click on the 'I have installed my software and need to authorize it' option and click next.
Choose to 'Authorize with ESRI now using the Internet.'

Click Next > and  you will be asked for some authorization information. Make sure to Use Utah State University as the organization. Fill out the rest as appropriate for your situation:

Make sure to specify that you are a student in the next screen.
Finally it asks for the Authorization number. Enter in the EVA code from the DVD case and/or your email from ESRI:
The next screen tends to confuse people. The extensions have already been installed, so you do not enter in licenses for these with the education version. Stick with the default, and proceed to the next screen.


Here you want to include access (for one year) to all those extensions you installed. Highlight the extensions you want to evaluate:
Then use the --> to move them to the right hand side and hit next:

Now, you should see it communicating with ESRI to authorize the software and extensions (number will vary):


Your software should now be authenticated and ready for one year of use. Enjoy. Exit The ArcGIS Administrator and start ArcGIS to make sure it works. Note you will need to turn on the extensions in ArcGIS for them to be accessible (seehere for help getting started).

What if it Fails to Authenticate?

If you get an error message during the 'Authorizing Software' like this:

Don't panic. This usually means that you failed to complete step one, you entered the wrong code in, you are using a code that has already been used elsewhere, or there is an internet connection problem. The authentication of the software (i.e. licensing) is totally separate from the installation of the software. The software can be completely installed, you just can't use it. There are many different ways to authenticate after the fact and this can be done using ArcGIS Administrator, which would have been installed with the software. To rectify the problem, complete step one (if you have not already) and then see below for instructions for authenticating after the fact. If this still does not work, try contacting ESRI Support.

Using ArcGIS Administrator to Authenticate After the Fact or License Renewal

If you need to modify your licenses, you can again use the License Manager. For example, if you purchase a license, or get another education edition license, you don't need to re-install the software. Instead  you can simply use the Administrator to update or change your license. You will see the following main screen:

Click on Desktop and you will see options. For an Educational edition you want to click on the Desktop and then change the settings in the dialog below to ArcInfo (Single Use) and then click on Authorize Now.
This will bring up the wizard. As you have already installed your software, click on the 'I have installed my software and need to authorize it' option and click next.

Choose to 'Authorize with ESRI now using the Internet.'

Click Next > and  you will be asked for some authorization information. Make sure to Use Utah State University as the organization. Fill out the rest as appropriate for your situation:
Make sure to specify that you are a student in the next screen.
Finally it asks for the Authroization number. Enter in the EVA code from the DVD case and/or your email from ESRI:
The next screen tends to confuse people. The extensions have already been installed, so you do not enter in licenses for these with the education version. Stick with the default, and proceed to the next screen.


Here you want to include access (for one year) to all those extensions you installed. Highlight the extensions you want to evaluate:
Then use the --> to move them to the right hand side and hit next:

Now, you should see it communicating with ESRI to authorize the software and extensions (number will vary):


Your software should now be authenticated and ready for one year of use. Enjoy. Exit The ArcGIS Administrator and start ArcGIS to make sure it works. Note you will need to turn on the extensions in ArcGIS for them to be accessible (seehere for help getting started).