By Lauren Scott and Nathan Warmerdam
Editor's note: Crime mapping using traditional GIS analysis techniques has been helping law enforcement agencies track crime incidents and produce density maps showing overall crime patterns. With improvements in the availability and quality of crime data in digital format and more robust GIS software, police departments have expanded the use of GIS. They are using spatial data analysis to assess crime patterns, optimize resource allocation, and improve emergency call response. The spatial statistics tools in ArcGIS enhance spatial data analysis of crime data by supplying tools that use statistical methods designed specifically for use with spatial data. This article describes how the Hot Spot Analysis, Mean Center, Linear Directional Mean, and Standard Deviational Ellipse tools, available at all license levels, can be used for more sophisticated types of crime analysis.
Understanding Where Crime Occurs
Crime hot spots are areas of high crime intensity. Knowing where crime is concentrated helps law enforcement agencies make better decisions about allocating police resources. In addition, using GIS to map crime hot spots can effectively communicate crime patterns and crime prevention strategies to decision makers and the public.
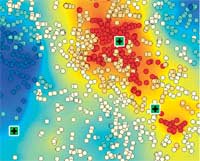
The Hot Spot Analysis tool in ArcGIS 9 identifies spatial clusters of statistically significant high or low attribute values. Given a set of weighted data points, such as the number of crimes per census block, and operating under the expectation that data values are randomly distributed across the study area, this tool delineates clusters of census blocks with higher than expected crime incidents. These clusters are hot spots. The Hot Spot Analysis tool also delineates spatial clusters of lower than expected crime incidents. These clusters reflect crime cold spots and may provide clues about policy or environmental factors that discourage crime.
Running the Hot Spot Analysis tool against raw total crime counts provides the analyst with an overall picture of crime patterns. A map of these crime patterns effectively communicates where crime activities are highest and where they are lowest. However, the police officers working in the study area day to day will likely already know firsthand where crime activities are highest. Often more useful are analyses that incorporate risk assessment by controlling study area variations in population, overall crime patterns, and environmental factors.
Performing Risk Assessment
One would expect more crimes in areas with more people and fewer crimes in areas with fewer people. Communities are a tapestry of neighborhoods (each one with different characteristics). In essence, a study area can be viewed as a landscape of crime. Gang activities; the types of businesses in an area; and factors that can be difficult to quantify, such as lighting, access to freeways, or a high proportion of residents with criminal records, can drive up the crime rate in some neighborhoods.
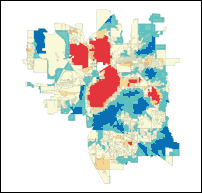
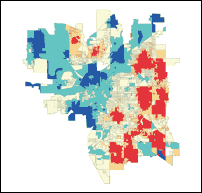
For example, if the task is to determine where to implement a vandalism prevention program, simply running the Hot Spot Analysis tool on raw vandalism counts will probably find hot spots just where they would be expected (in downtown areas that have lots of people and, typically, lots of crime). However, dividing vandalism counts in each census tract by all crime counts will represent vandalism counts as a proportion of all crime events. Running the hot spot analysis on these normalized ratios will provide a different picture. It will show the location of clusters of tracts in which vandalism represents a larger than expected proportion of all crime events. Such an analysis, carried out on crime data from Lincoln, Nebraska, showed that vandalism is primarily a suburban issue. Consequently, implementing a vandalism prevention program in the downtown area probably would not be as effective as implementing a program in the suburbs where vandalism constitutes a larger proportion of overall crime events.
Looking for Clues to Criminal Activities
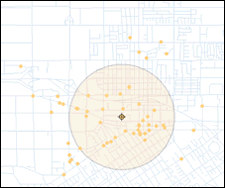
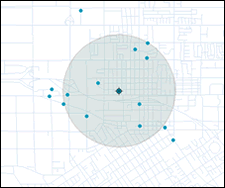
One of the simplest approaches to better understand some factors that encourage criminal activity is examining the distribution of different types of crimes. A crime analyst, for example, might want to know if the mean center for burglaries shifts when evaluating daytime versus nighttime crime incidents. This information could be used to improve the way police departments assign personnel. The Mean Center tool available in ArcGIS 9 computes the average x-coordinate and y-coordinate for each crime incident in the study area.
Another new tool for studying the distribution of crime incidents works with line data. The Linear Directional Mean tool is used to measure the trend of either the direction or orientation of line features by calculating the average angle of the lines. This statistic can be used to evaluate auto theft data that contains information on the location from which each vehicle was taken and where it was eventually recovered. Analyzing this data using the Linear Directional Mean tool highlights recurring patterns that can suggest an underlying infrastructure supporting car thefts in the region. Similar analysis has been used to study data on missing/abducted children.
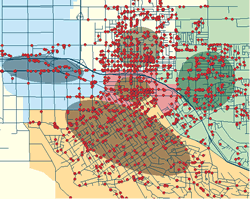 |
| Analysis of the spatial dispersion of crimes by police beat in Redlands, California, shows that crimes in the western portion of the city follow major transportation networks in the area. |
When crime distributions are compared to other features in the landscape, similarities or relationships often become apparent. The most common way for measuring the trend for points or areas is to calculate the standard distance separately in the x and y directions. These two measures define the axes of an ellipse encompassing the distribution of features. The ellipse is referred to as the standard deviational ellipse since the method calculates the standard deviation of the x-coordinates and y-coordinates from the mean center to define the axes of the ellipse. This ellipse shows if the distribution of features is elongated, which indicates it has a particular orientation.
For example, crime events grouped by police beat and evaluated using the Standard Deviational Ellipse tool may show that, for some police beats, crime activities are evenly distributed throughout the beat so the ellipse resembles a circle. In other cases, crime activities tend to follow road networks, and crime incidents in these police beats show that orientation.
Conclusion
By placing crime incidents in a geographic context and applying the spatial statistical analysis tools now available in ArcGIS 9, crime analysts can better understand where and why crime activity is occurring and law enforcement agencies can respond in the most efficient and effective manner.
Additional Resources
Not only crime analysts but also GIS practitioners in many research areas, such as epidemiology, archaeology, wildlife biology, and retail analysis, will benefit from the spatial statistics tools in ArcGIS 9. These tools can be easily modified or extended because most were written using the Python scripting language. The source code for the statistical tools can be accessed from ArcToolbox and serve as samples and templates for further customization. For more information about scripting in the ArcGIS geoprocessing environment, select Geoprocessing >Writing Geoprocessing Scripts on the Contents tab of the ArcGIS 9 Online Help.
The Esri Guide to GIS Analysis, Volume 2, an Esri Press book scheduled for release in the third quarter of 2005, provides additional specific information on spatial statistics tools and more general information on spatial data analysis using GIS. It is the second in a series by Andy Mitchell. The first book,The Esri Guide to GIS Analysis, Volume 1, focuses on visual and cartographic methods of spatial data analysis. Both books can be purchased online at www.esri.com/shop.
Online resources are also available. A five-minute video showing hot spot analysis of emergency 911 call data is available on the Esri Web site. An article describing the tools in the Spatial Statistics toolbox appeared in the October–December 2004 issue of ArcUser and is available online. For more information on the Python scripting language, visit www.Python.org.
About the Authors
Dr. Lauren Scott works on the ArcGIS Geoprocessing Team and developed the tools in the Spatial Statistics toolbox. She holds a Ph.D. in geography from the joint doctoral program at San Diego State University in California and the University of California, Santa Barbara.
Nathan Warmerdam works as a product specialist on the Geoprocessing Team. He holds a master's degree in geographic information science from the University of Redlands in California.
source esri.com
No comments:
Post a Comment