liste

Bonjour et bienvenue dans mon site ! Willkommen auf meiner Seite! welcome in my homepage! http://assistance-en-sig.blogspot.com/ SIG ; Bases de données ; Géomatique; Python; ArcGIS; QGIS;

recherche

Showing posts with label spatial. Show all posts

Wednesday, August 21, 2013

Extend Crime Analysis with ArcGIS 10 Spatial Statistics Tools

By Lauren Scott and Nathan Warmerdam

Editor's note: Crime mapping using traditional GIS analysis techniques has been helping law enforcement agencies track crime incidents and produce density maps showing overall crime patterns. With improvements in the availability and quality of crime data in digital format and more robust GIS software, police departments have expanded the use of GIS. They are using spatial data analysis to assess crime patterns, optimize resource allocation, and improve emergency call response. The spatial statistics tools in ArcGIS enhance spatial data analysis of crime data by supplying tools that use statistical methods designed specifically for use with spatial data. This article describes how the Hot Spot Analysis, Mean Center, Linear Directional Mean, and Standard Deviational Ellipse tools, available at all license levels, can be used for more sophisticated types of crime analysis.

Understanding Where Crime Occurs

Crime hot spots are areas of high crime intensity. Knowing where crime is concentrated helps law enforcement agencies make better decisions about allocating police resources. In addition, using GIS to map crime hot spots can effectively communicate crime patterns and crime prevention strategies to decision makers and the public.
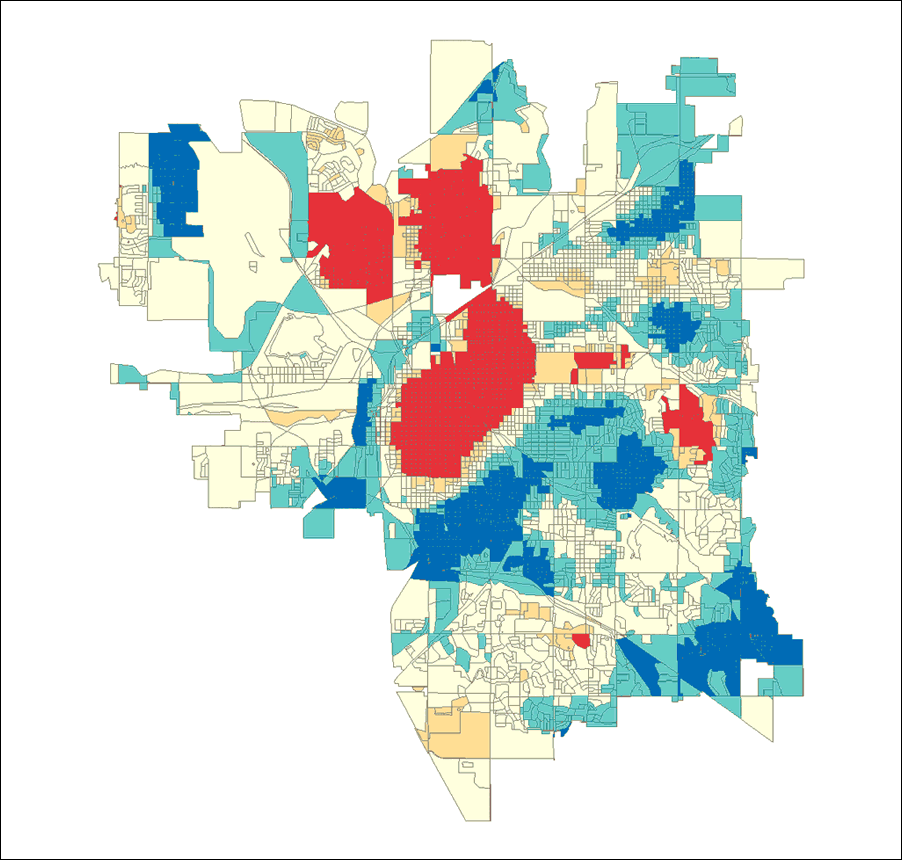
The Hot Spot Analysis tool in ArcGIS 9 identifies spatial clusters of statistically significant high or low attribute values. Given a set of weighted data points, such as the number of crimes per census block, and operating under the expectation that data values are randomly distributed across the study area, this tool delineates clusters of census blocks with higher than expected crime incidents. These clusters are hot spots. The Hot Spot Analysis tool also delineates spatial clusters of lower than expected crime incidents. These clusters reflect crime cold spots and may provide clues about policy or environmental factors that discourage crime.
click to enlargeclick to enlarge
Crime hot spots generated from vandalism data for Lincoln, Nebraska, that have not been normalized. Hot spots are shown in bright red and located in downtown Lincoln, an area with a large population. Cold spots, or areas of low crime, are shown in dark blue and are located in suburban areas.Hot spot analysis using vandalism data that was normalized with data from all crime incidents for Lincoln, Nebraska. Again, areas with high incidence of vandalism are shown in bright red and low vandalism areas are shown in dark blue.
Running the Hot Spot Analysis tool against raw total crime counts provides the analyst with an overall picture of crime patterns. A map of these crime patterns effectively communicates where crime activities are highest and where they are lowest. However, the police officers working in the study area day to day will likely already know firsthand where crime activities are highest. Often more useful are analyses that incorporate risk assessment by controlling study area variations in population, overall crime patterns, and environmental factors.

Performing Risk Assessment

One would expect more crimes in areas with more people and fewer crimes in areas with fewer people. Communities are a tapestry of neighborhoods (each one with different characteristics). In essence, a study area can be viewed as a landscape of crime. Gang activities; the types of businesses in an area; and factors that can be difficult to quantify, such as lighting, access to freeways, or a high proportion of residents with criminal records, can drive up the crime rate in some neighborhoods.
For example, if the task is to determine where to implement a vandalism prevention program, simply running the Hot Spot Analysis tool on raw vandalism counts will probably find hot spots just where they would be expected (in downtown areas that have lots of people and, typically, lots of crime). However, dividing vandalism counts in each census tract by all crime counts will represent vandalism counts as a proportion of all crime events. Running the hot spot analysis on these normalized ratios will provide a different picture. It will show the location of clusters of tracts in which vandalism represents a larger than expected proportion of all crime events. Such an analysis, carried out on crime data from Lincoln, Nebraska, showed that vandalism is primarily a suburban issue. Consequently, implementing a vandalism prevention program in the downtown area probably would not be as effective as implementing a program in the suburbs where vandalism constitutes a larger proportion of overall crime events.
click to enlargeclick to enlarge
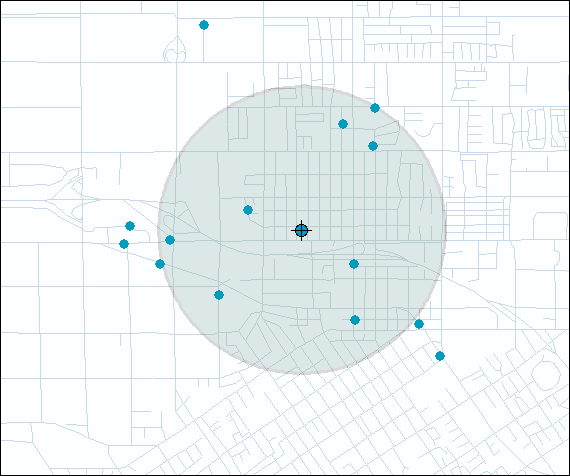
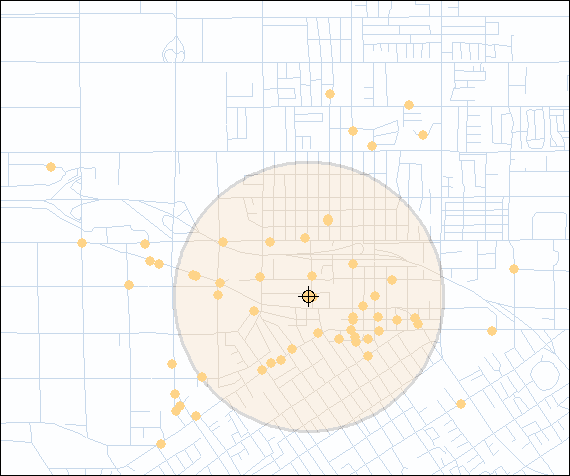
Daytime burglaries tend to be slightly more concentrated than nighttime burglaries, indicated by the smaller standard distance circle. These circles also highlight the differences in the locations of daytime and nighttime burglaries.

Looking for Clues to Criminal Activities

One of the simplest approaches to better understand some factors that encourage criminal activity is examining the distribution of different types of crimes. A crime analyst, for example, might want to know if the mean center for burglaries shifts when evaluating daytime versus nighttime crime incidents. This information could be used to improve the way police departments assign personnel. The Mean Center tool available in ArcGIS 9 computes the average x-coordinate and y-coordinate for each crime incident in the study area.
Another new tool for studying the distribution of crime incidents works with line data. The Linear Directional Mean tool is used to measure the trend of either the direction or orientation of line features by calculating the average angle of the lines. This statistic can be used to evaluate auto theft data that contains information on the location from which each vehicle was taken and where it was eventually recovered. Analyzing this data using the Linear Directional Mean tool highlights recurring patterns that can suggest an underlying infrastructure supporting car thefts in the region. Similar analysis has been used to study data on missing/abducted children.
click to enlarge
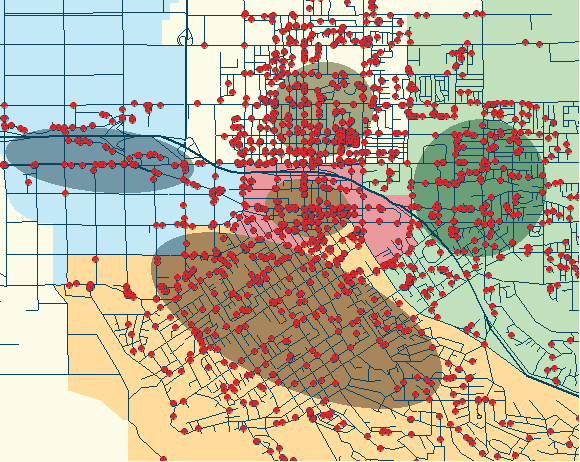
Analysis of the spatial dispersion of crimes by police beat in Redlands, California, shows that crimes in the western portion of the city follow major transportation networks in the area.
When crime distributions are compared to other features in the landscape, similarities or relationships often become apparent. The most common way for measuring the trend for points or areas is to calculate the standard distance separately in the x and y directions. These two measures define the axes of an ellipse encompassing the distribution of features. The ellipse is referred to as the standard deviational ellipse since the method calculates the standard deviation of the x-coordinates and y-coordinates from the mean center to define the axes of the ellipse. This ellipse shows if the distribution of features is elongated, which indicates it has a particular orientation.
For example, crime events grouped by police beat and evaluated using the Standard Deviational Ellipse tool may show that, for some police beats, crime activities are evenly distributed throughout the beat so the ellipse resembles a circle. In other cases, crime activities tend to follow road networks, and crime incidents in these police beats show that orientation.

Conclusion

By placing crime incidents in a geographic context and applying the spatial statistical analysis tools now available in ArcGIS 9, crime analysts can better understand where and why crime activity is occurring and law enforcement agencies can respond in the most efficient and effective manner.

Additional Resources

Not only crime analysts but also GIS practitioners in many research areas, such as epidemiology, archaeology, wildlife biology, and retail analysis, will benefit from the spatial statistics tools in ArcGIS 9. These tools can be easily modified or extended because most were written using the Python scripting language. The source code for the statistical tools can be accessed from ArcToolbox and serve as samples and templates for further customization. For more information about scripting in the ArcGIS geoprocessing environment, select Geoprocessing >Writing Geoprocessing Scripts on the Contents tab of the ArcGIS 9 Online Help.
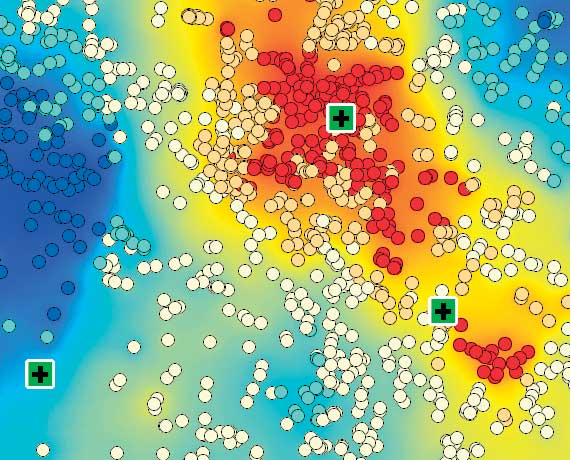
click to enlarge
Analysis of 911 emergency calls shows regions that get many calls in bright red and regions that get few calls in dark blue and the relationship of those areas to local police and fire response stations, indicated by bright green squares.
The Esri Guide to GIS Analysis, Volume 2, an Esri Press book scheduled for release in the third quarter of 2005, provides additional specific information on spatial statistics tools and more general information on spatial data analysis using GIS. It is the second in a series by Andy Mitchell. The first book,The Esri Guide to GIS Analysis, Volume 1, focuses on visual and cartographic methods of spatial data analysis. Both books can be purchased online at www.esri.com/shop.
Online resources are also available. A five-minute video showing hot spot analysis of emergency 911 call data is available on the Esri Web site. An article describing the tools in the Spatial Statistics toolbox appeared in the October–December 2004 issue of ArcUser and is available online. For more information on the Python scripting language, visit www.Python.org.

About the Authors

Dr. Lauren Scott works on the ArcGIS Geoprocessing Team and developed the tools in the Spatial Statistics toolbox. She holds a Ph.D. in geography from the joint doctoral program at San Diego State University in California and the University of California, Santa Barbara.
Nathan Warmerdam works as a product specialist on the Geoprocessing Team. He holds a master's degree in geographic information science from the University of Redlands in California.
source esri.com

Thursday, April 18, 2013

IRAQ - download free spatial Data

IRAQ - 1:250K Geological Vector Data
Once again our talented procurement department has done its job. This time they bring us a gem of data in the form of 1:250K geological vector data over the entire country of Iraq. It is truly an astonishing feat to have this data on hand and the benefits it can bring to our clients are endless.


Iraq 250K Geological Index Map
1:250K Geological Vector Index Map - Iraq


Scale: 1:250,000
Coverage: Complete, 35 sheet series
Publish years: 1995-2008
Publisher: State Establishment of Geological Survey and Mining (GEOSURV), Baghdad, Iraq.
Language: English language
Also available: Digital explanatory notes for each map sheet (Word or .pdf format) also in English.

Formats available:
Paper
Raster
Georeferenced raster
GIS/Vector

Iraq 250K Geological Vector Sample
1:250K Geological Vector Data - Iraq


The maps that make up this dataset are extremely rare and difficult to obtain. We have gotten the hard part out of the way and now they are easily available to you.

irak, free, vector, spatial data, download, shape, shp, imagery,

Saturday, March 30, 2013

GIS Spatial Data Types


GIS Spatial Data Types


In GIS, there are 2 basic spatial data types representing the real world:
Raster and Vector


The Real World 

In this example, our landscape consists of
  • rolling hills
  • grassland
  • lake
  • rivers
  • forest stands
  • marsh
It can be represented as a series of raster layers and/or vector layers.


Raster Data
In the raster data model, land cover is represented as:
  • single square cells

Each cell will have a value corresponding to its land cover type.

Raster data are good at:
  • representing continuous data (e.g., slope, elevation, chemical concentrations)
  • representing multiple feature types (e.g., points, lines, and polygons) as single feature types (cells)
  • rapid computations ("map algebra") in which raster layers are treated as elements in mathematical expressions
  • analysis of multi-layer or multivariate data (e.g., satellite image processing and analysis)
  • hogging disk space


Vector Data
In the vector data model, features on the earth are represented as
  • points
  • lines / routes
  • polygons / regions
  • TINs (triangulated irregular networks)

Vector data are good at
  • accurately representing true shape and size
  • representing non-continuous data (e.g., rivers, political boundaries, road lines, mountain peaks)
  • creating aesthetically pleasing maps
  • conserving disk space


Different types of data are
stored in different
file formats.


images © ESRI

Wednesday, January 16, 2013

Online Spatial Data Sources - FEDERAL GOVERNMENT RESOURCES


THE UNITED STATES GEOLOGICAL SURVEY: (http://www.usgs.gov/). Home of the National Mapping Division, host for the Federal Geographic Data Committee (http://fgdc.er.usgs.gov/), the National Spatial Data Infrastructure, and headquarters for the data archive at the EROS Data Center (http://edcftp.cr.usgs.gov/).
THE UNITED STATES CENSUS BUREAU,  Department of Commerce: Home of the TIGER data for computer mapping.  (http://www.census.gov/)
TERRASERVER: An amalgam of government and private-sector companies, this site is part of the Microsoft network, in collaboration with the USGS, Compaq, Storage Works and Spin-2.  The site allows users to download aerial photos and satellite images, searchable by name or location in a variety of scales.  Claiming to be the largest online database, it contains over 3 TeraBytes of digital information. Very cool!  (http://www.terraserver.microsoft.com/)
NATIONAL GEOPHYSICAL DATA CENTER: Location for all sorts of geologial and earth resources information and data. (http://www.ngdc.noaa.gov/ngdc.html)
NATIONAL OCEAN SERVICE: Center of information for mapping and charting of ports and oceans etc. (http://www.nos.noaa.gov/)
NATIONAL IMAGERY AND MAPPING AGENCY. The Agency's site provides ready access to the world's imagery, imagery intelligence and geospatial information.  (http://164.214.2.59/)
DEFENSE MAPPING AGENCY TERRAIN MAPPING PROJECT OFFICE: Data collections and information on terrain mapping. (http://164.214.2.53:8001/)
NASA: Source of much existing data, and includes details of planned future systems. Many links
to follow, including a master data base to facilitate searching. (http://www.nasa.gov/)

Saturday, November 24, 2012

Free Spatial Data


Country level

Download country level data for any country in the world: administrative boundaries, roads, railroads, altitude, land cover, population density.

Global level

A new file with the (2011) global country boundaries

Global climate data

See WorldClim or diva-gis specific data here

Species occurrence data

Crop (genebank) collection data

Near global 90 meter resolution elevation data

High resolution satellite images (LandSat)

for nearly all of the world can be downloaded here. They are in the MrSid format that can be visualized in DIVA-GIS (note: they are in UTM projections, so you will need to project your shapefiles to UTM as well).

A very good list

of data sources from the Eden project.

Source (www.diva-gis.org)

Interested with this article, thanks for making a donation by clicking one of the ads

Vous trouvez ce document utile! merci de nous faire un petit don en cliquant sur un des liens publicitaires

Friday, November 23, 2012

What Is PostGIS?


PostGIS is an open source, freely available, and fairly OGC compliant spatial database extender for the PostgreSQL Database Management System. In a nutshell it adds spatial functions such as distance, area, union, intersection, and specialty geometry data types to the database. PostGIS is very similar in functionality to SQL Server 2008 Spatial support, ESRI ArcSDE, Oracle Spatial, and DB2 spatial extender. The latest release version now comes packaged with the PostgreSQL DBMS installs as an optional add-on. As of this writing PostGIS 2.0.0 is the latest stable release.

Wednesday, November 14, 2012

List of geographic information systems software

GIS software encompasses a broad range of applications, all of which involve the use of some combination of digital maps and georeferenced data. GIS software can be sorted into different categories. Below is a list of notable GIS software applications. Please update the listing of software below with respect to the different categories.

Open source software

The development of open source GIS software has - in terms of software history - a long tradition with the appearance of a first system in 1978. Numerous systems are nowadays available which cover all sectors of geospatial data handling.

Desktop GIS

The following open source desktop GIS projects are reviewed in Steiniger and Bocher (2008/9)
gvSIG 1.0
  
GRASS GIS 6.4
  
Capaware rc1 0.1
  
SAGA-GIS v. 2.0.3
 
Whitebox GAT 1.0.2
  
IDRISI Taiga 16.05
  • GRASS GIS – Originally developed by the U.S. Army Corps of Engineers, open source: a complete GIS
  • SAGA GIS – System for Automated Geoscientific Analysis- a hybrid GIS software. SAGA has a unique Application Programming Interface (API) and a fast growing set of geoscientific methods, bundled in exchangeable Module Libraries.
  • Quantum GIS – QGIS is an Open Source GIS that runs on Linux, Unix, Mac OS X, and Windows.
  • MapWindow GIS – Free, open source GIS desktop application and programming component.
  • ILWIS – ILWIS (Integrated Land and Water Information System) integrates image, vector and thematic data.
  • uDig – Open source GIS desktop application (API and source code (Java) available).
  • gvSIG – Open source GIS written in Java.
  • JUMP GIS / OpenJUMP – (Open) Java Unified Mapping Platform (the desktop GIS OpenJUMP, SkyJUMP, deeJUMP and Kosmo emerged from JUMP; )
other:
  • Whitebox GAT – Open source and transparent GIS software
  • Kalypso (software) – Kalypso is an Open Source GIS (Java, GML3) and focuses mainly on numerical simulations in water management.
  • TerraView – GIS desktop that handles vector and raster data stored in a relational or geo-relational database, i.e. a frontend for TerraLib.
  • Capaware – Capaware is also an Open Source GIS, an incredible fast C++ 3D GIS Framework with a multiple plugin architecture for geographic graphical analysis and visualization.
  • FalconView – FalconView is a mapping system created by the Georgia Tech Research Institute for the Windows family of operating systems. A free, open source version is available.

Other GIS tools - classified.

WebMap Server
  • Mapnik - C++/Python library for rendering - used by OpenStreetMap
  • GeoServer
  • MapGuide Open Source – Web-based mapping server.
  • MapServer – Web-based mapping server, developed by the University of Minnesota.
Spatial Database Management Systems
  • PostGIS – Spatial extensions for the open source PostgreSQL database, allowing geospatial queries.
  • TerraLib is a spatial DBMS and also provides advanced functions for GIS analysis.
  • SpatiaLite – Spatial extensions for the open source SQLite database, allowing geospatial queries.
Software Development Frameworks and Libraries (non-web)
  • GeoTools – Open source GIS toolkit written in Java, using Open Geospatial Consortium specifications.
  • GDAL / OGR
  • Orfeo toolbox
Software Development Frameworks and Libraries (for web applications)
  • OpenLayers – open source AJAX library for accessing geographic data layers of all kinds, originally developed and sponsored by MetaCarta.
  • MapFish
  • GeoBase (Telogis GIS software) - Geospatial mapping software available as a Software development kit, which performs various functions including address lookup, mapping, routing, reverse geocoding, and navigation. Suited for high transaction enterprise environments.
Cataloging application for spatially referenced resources
  • GeoNetwork opensource – A catalog application to manage spatially referenced resources

Other GIS tools - unclassified

  • ST-Links – Connection tool for working with ArcMap and spatial databases PostGres/PostGIS, SQL Server spatial.
  • Chameleon – Environments for building applications with MapServer.
  • MapPoint, a technology ("MapPoint Web Service," previously known as MapPoint .NET) and a specific software program created by Microsoft that allows users to view, edit and integrate maps.

Notable commercial or proprietary GIS software

Desktop GIS provider

Note: Almost all of the below companies offer Desktop GIS and WebMap Server products. Some offer Spatial DBMS products as well.

COMPANIES WITH HIGH MARKET SHARE

  • Autodesk – Products include Map 3D, Topobase, MapGuide and other products that interface with its flagship AutoCAD software package.
  • Bentley Systems – Products include Bentley Map, Bentley Map View and other products that interface with its flagship MicroStation software package.
  • ERDAS IMAGINE by ERDAS Inc; products include Leica Photogrammetry Suite, ERDAS ER Mapper, and ERDAS ECW JPEG2000 SDK (ECW (file format))are used throughout the entire mapping community (GIS, Remote Sensing, Photogrammetry, and image compression).
  • Esri – Products include ArcView 3.x, ArcGIS, ArcSDE, ArcIMS, ArcWeb services and ArcGIS Server.
  • Intergraph – Products include G/Technology, GeoMedia, GeoMedia Professional, GeoMedia WebMap, and add-on products for industry sectors, as well as photogrammetry.
  • MapInfo by Pitney Bowes – Products include MapInfo Professional and MapXtreme.
  • Smallworld – developed in Cambridge, England (Smallworld, Inc.) and purchased by General Electric and used primarily by public utilities.

COMPANIES WITH MINOR BUT NOTABLE MARKET SHARE

  • Aquaveo - Developers of GMS, WMS, SMS, which are modular hydrology programs with 3D mapping features.
  • Cadcorp – Products include Cadcorp SIS, GeognoSIS, mSIS and developer kits
  • Caliper – Products include Maptitude, TransModeler and TransCAD
  • Dragon/ips – Remote sensing software with some GIS capabilities.
  • ENVI - Utilized for image analysis, exploitation, and hyperspectral analysis.
  • Field-Map : GIS tool designed for computer aided field data collection, used mainly for mapping of forest ecosystems.
  • IDRISI – GIS and Image Processing product developed by Clark Labs at Clark University. Affordable and robust, it is used for both operations and education.
  • Manifold System – GIS software package.
  • Netcad – Desktop and web based GIS products developed by Ulusal CAD ve GIS Çözümleri A.Ş.
  • RegioGraph by GfK GeoMarketing; GIS software for business planning and analyses; company also provides compatible maps and market data.

Spatial DBMS

  • VMDS version managed data store from smallworld
  • Boeing's Spatial Query Server spatially enables Sybase ASE.
  • DB2 – Allows spatial querying and storing of most spatial data types.
  • Informix – Allows spatial querying and storing of most spatial data types.
  • Microsoft SQL Server 2008 – The latest player in the market of storing and querying spatial data. At this stage only some GIS products such as MapInfo and Cadcorp SIS can read and edit this data while ESRI and others are expected to be able to read and edit this data within the next few months
  • Oracle Spatial – Product allows users to perform complex geographic operations and store common spatial data types in a native Oracle environment. Most commercial GIS packages can read and edit spatial data stored in this way.
  • PostGIS – a spatial database based on the free PostgreSQL database

Spatial ETL Tools

  • Safe Software – Spatial ETL products including FME Desktop, FME Server and the ArcGIS Data Interoperability Extension.
  • ST-Links PgMap for converting spatial data between databases and feature classes. It is and connection tool for ArcMap to view/edit/convert spatial data in databases systems.
(www.environment.gen)

Saturday, October 27, 2012

Tutorial Oracle Spatial


Résumé

Le présent document est un tutorial pour la gestion des données spatiales des base de données Oracle. Il n'est de loin pas exhaustif, mais il donne un aperçu des possibilités offerers par Oracle spatial et ces concurrents.